MSP Housing + Transportation Cost Calculator
Getting Started |
|
|
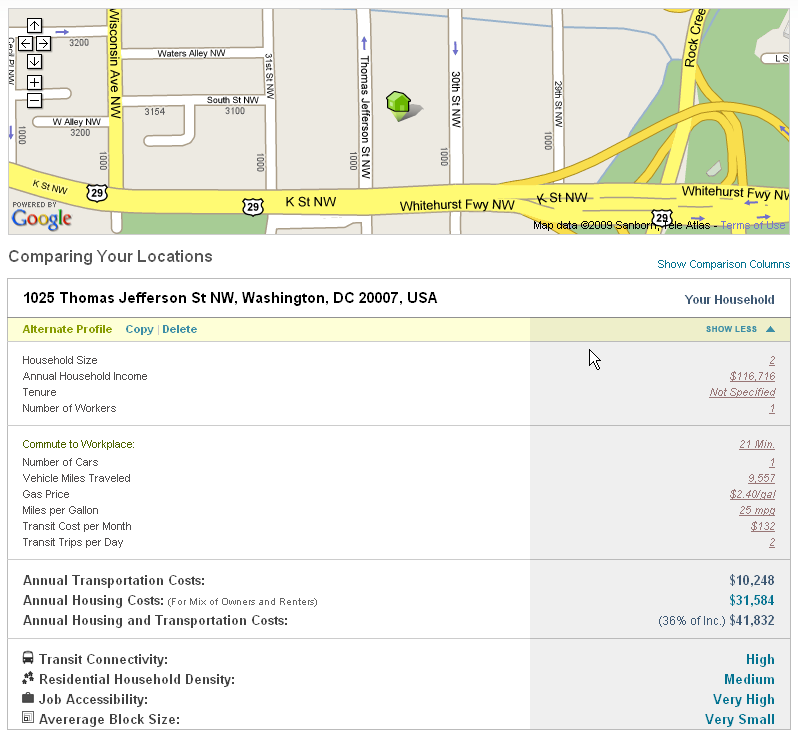
Enter your home address into the "New Address" box and click the "ADD" button. The calculator will then use this address to find your neighborhood, and then pull some basic characteristics of this community. It will then estimate how much the average household in this location spends on housing and transportation. It will also add this location to the map at the top of the page. The result will look like the image below: |

|
|
|
Modifying Inputs |
|
|
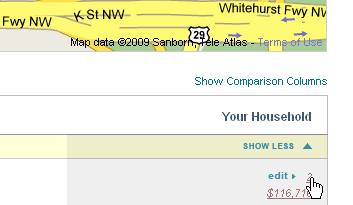
Of course you are not average, so we allow you to enter your own household's information. In order to change any one piece of information, simply click on it, and an edit menu will appear. For example if there are three people in your household, you will want to click on the number at the right, representing the average Household Size in the area you specified. |
 |
|
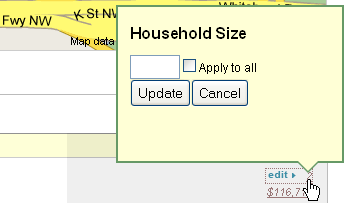
This will bring up the household size menu. |
 |
|
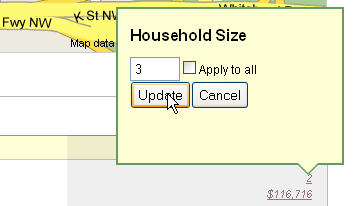
Here, you enter the number of people in the household and click the Update button |
 |
|
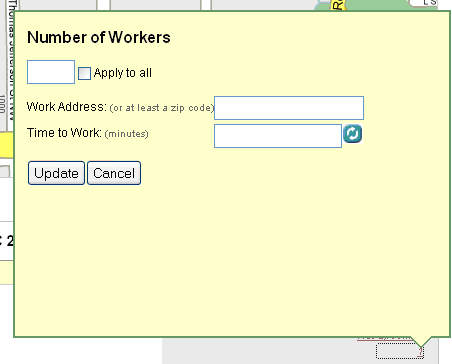
Another piece of information that you may want to change is Number of Workers. Again, click on the number at the right representing the average number of workers per household in your neighborhood to bring up the edit box. |
 |
|
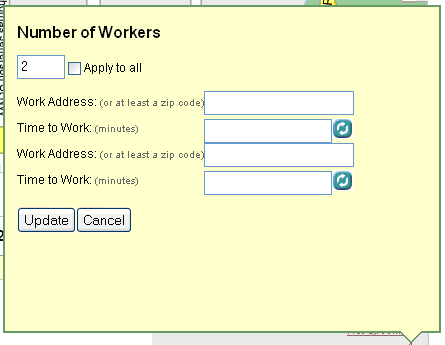
If, for example, there are two workers in your household, you will see two entry boxes appear for Work Address and Time to Work as soon as you input "2" in the entry box for Number of Workers. |
 |
|
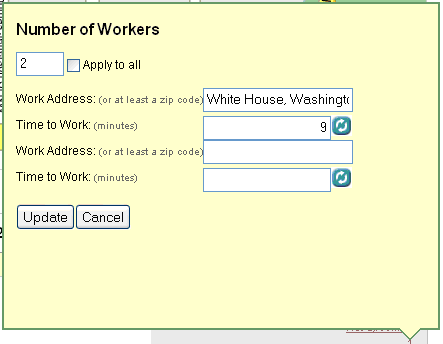
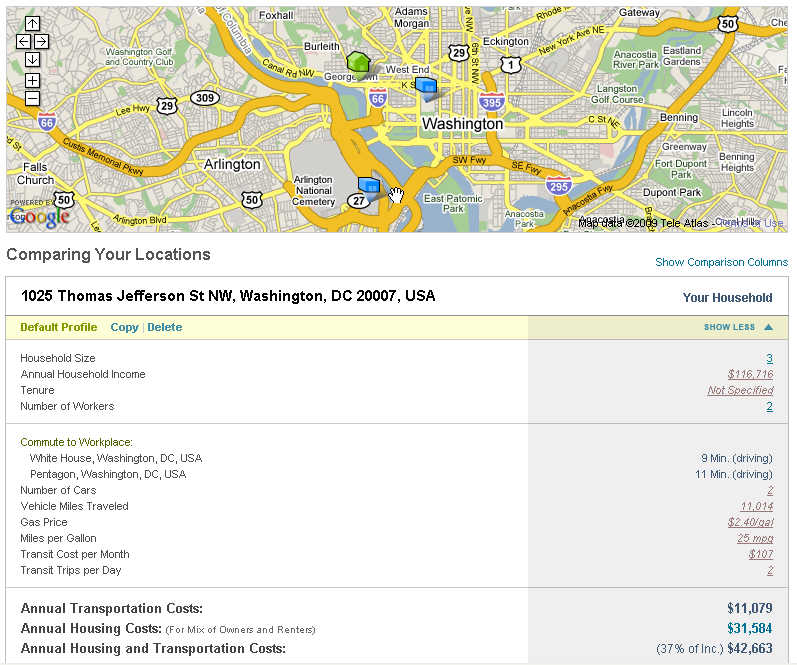
Now you will want to input the work addresses for your household's two workers. Click the enter key after inputting the first address and the calculator will estimate how long it takes you to get to work. If you disagree with the calculator's findings for this, simply click on the number to change it. Do the same thing for your second work address and then click "Update" to accept the inputs you've made. You will now notice that the values for Numbers of Workers and Commute to Workplace have both been updated to reflect your household inputs. The map has also been updated to show the place(s) of work (see below). |
 |
|
|
|
Proceed on in this manner to customize the inputs for Annual Household Income, Tenure (do you own or rent?), Number of Cars, Vehicle Miles Traveled, Gas Price, Miles per Gallon, Transit Cost per Month, and Transit Trips per Day. Again, the values on the right in purple represent average values for the average household in the neighborhood you've selected by inputting your address. If you do not know the value specific to your household for any given variable, you can choose to leave the neighborhood average by simply not clicking on it to edit it. At any point while you are customizing these variables to reflect your household, you will be able to see the Annual Transportation Costs, Annual Housing Costs and the Annual Housing and Transportation Costs. If you choose to not customize any of the inputs, the values given here will represent the household averages in the neighborhood of the address you've input. However, as you change the inputs, these three costs will change to reflect the changes you've made to the household variables. | |
Comparing Results |
|
|
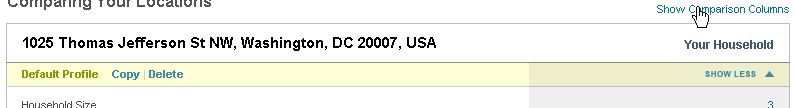
Many different comparisons can be made using this calculator. First, you can see how your household compares to others by clicking on the Show Comparison Columns in the upper right of the screen. | |
|
|
|
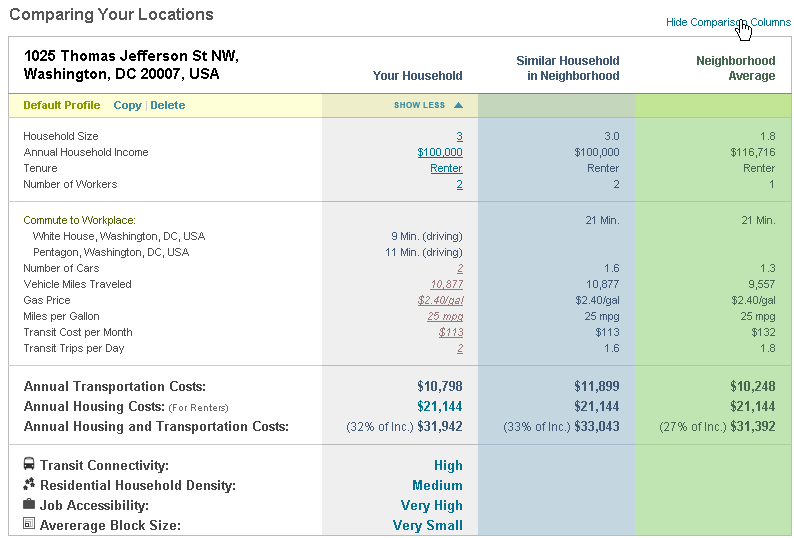
Now you will see three columns; Your Household, Similar Household in Neighborhood, and Neighborhood Average. The Similar Household in Neighborhood column represents a household in which the Household Size, Income, Tenure, and Number of Workers are all the same as the values you input for your household. However, Commute to Workplace, Number of Cars, Vehicle Miles Traveled, Gas Price, Miles per Gallon, Transit Cost per Month, and Transit Trips per Day all reflect the averages in your neighborhood. The Neighborhood Average column represents the average values for all variables in your neighborhood (these are all of the purple values initially presented before you began to customize the inputs). | |
|
|
|
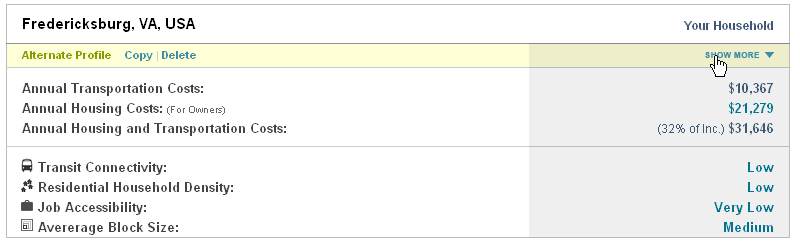
Another comparison that this calculator was designed to make is the change in costs that would result from moving to a new location. To begin making this comparison, enter the new address you would like to consider at the bottom of the screen Click Add and you will see the annual costs associated with this location appear beneath your original location, as well as the location indicated on the map. |

|
|
|
|
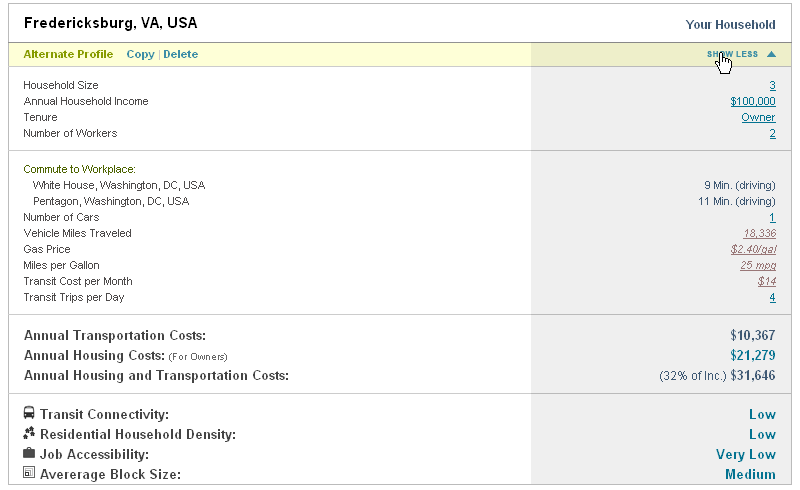
You'll notice here that this box is condensed and you cannot see all of the input variables that factor in to these resulting costs. Click on Show More to expand this view and see all of the variables. Here you can see that the calculator automatically input your household variables (Size, Income, Tenure, and Number of Workers and work locations) but used averages for variables pertaining to the new neighborhood you've identified (Number of Cars, Vehicle Miles Traveled, Gas Price, Miles per Gallon, Transit Cost per Month and Transit Trips per Day). Again, you can edit any of these variables as described above. |
|
|
|
|
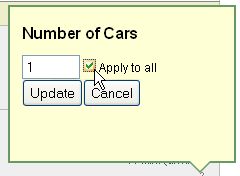
You can repeat this process and add as many address as you would like to compare. Condensing all of the boxes by clicking on Show Less will enable easier comparison between multiple addresses. Notice that as you change your household information you have the option of applying the change to all. This allows you to make a change for one address, but make that affect all the other. As an example if you are thinking of getting rid on one car and would like to see how that would affect you costs in all locations, you can accomplish this by using the "Apply to All" check box. |
|
|
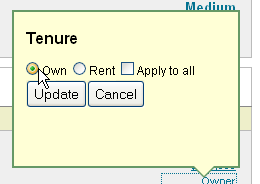
Conversely if you want to change a piece of information for only one address don't check this box. For example if you are renting in Georgetown but are thinking of buying in Fredericksburg, this change can easily be applied. |
|
|
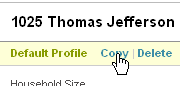
Another comparison that you may want to make is the change in costs that will result from changing one of the input variables. For example, how will your costs change if you stay in the same location but sell your car(s) and take transit? For this, you will want to choose the address for which you want to make the comparison, and click on Copy in the upper left of the box. |
|
|
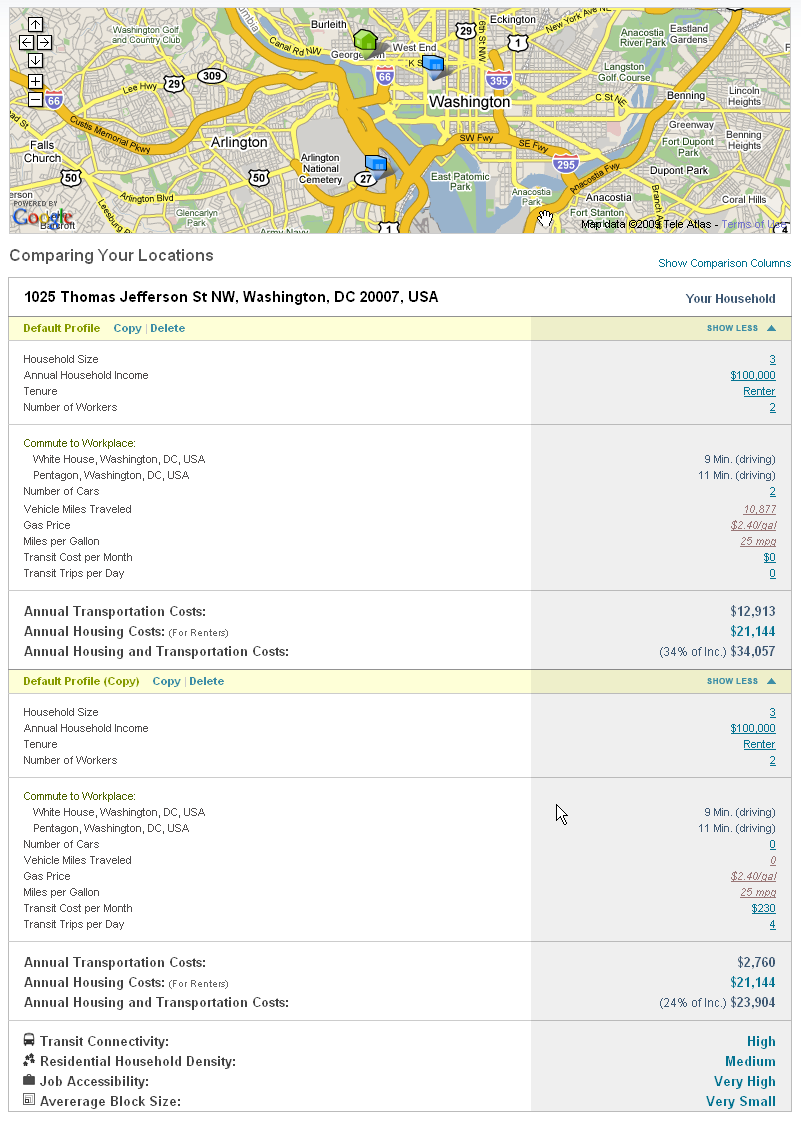
Now you can edit the variables, such as Number of Cars and Transit Trips per Day, but leave everything else the same, and see how your costs will change. For example, if you are deciding to sell you cars and rely totally on transit, you can use the same location but change these pieces of information to find out the benefits of the choices you might make. Below is the summary of this. |
|
|
|